Essay
Ages of Workers The ages (in years)of three groups of workers are shown below: 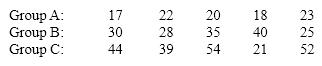 {Ages of Workers Narrative} Compute and compare the coefficient of variation for the three samples.
Correct Answer:

Verified
cv = 0.127, 0.188, and 0.315 for Groups ...View Answer
Unlock this answer now
Get Access to more Verified Answers free of charge
Correct Answer:
Verified
View Answer
Unlock this answer now
Get Access to more Verified Answers free of charge
Q51: Which of the following measures of variability
Q83: A percentile is a measure of _
Q132: The distance between the 25<sup>th</sup> percentile and
Q151: The median of a set of data
Q182: Any points that lie outside the whiskers
Q209: Weights of Teachers The following data represent
Q211: The _ is the least desirable of
Q211: Computers The following data represent the number
Q216: Weights of Workers The following data represent
Q219: Yearly Donations The following data represent the