Essay
Aptitude Test Scores Two random samples of 40 students were drawn independently from two populations of students. Assume their aptitude tests are normally distributed (total points = 100). The following statistics regarding their scores in an aptitude test were obtained: 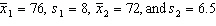 . {Aptitude Test Scores Narrative} Estimate with 95% confidence the difference between the two population means.
Correct Answer:

Verified
4 ± 3.25. Thus, LCL = 0.75, an...View Answer
Unlock this answer now
Get Access to more Verified Answers free of charge
Correct Answer:
Verified
View Answer
Unlock this answer now
Get Access to more Verified Answers free of charge
Q16: When the population variances are unequal, we
Q20: The variance of <img src="https://d2lvgg3v3hfg70.cloudfront.net/TBX8689/.jpg" alt="The variance
Q21: Additives A food processor wants to compare
Q22: A behaviorist has performed the following experiment.
Q23: Additives A food processor wants to compare
Q33: In testing the difference between the means
Q48: Two samples of sizes 25 and 20
Q60: If you are testing to see if
Q113: If there are 10 pairs of data
Q231: The number of degrees of freedom associated