Essay
Student's Final Grade A statistics professor investigated some of the factors that affect an individual student's final grade in her course. She proposed the multiple regression model 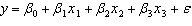 , where y is the final grade (out of 100 points), x 1 is the number of lectures skipped, x 2 is the number of late assignments, and x 3 is the midterm exam score (out of 100). The professor recorded the data for 50 randomly selected students. The computer output is shown below. THE REGRESSION EQUATION IS
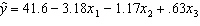
S = 13.74 R - Sq = 30.0%
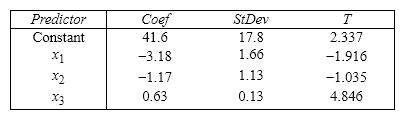
 {Student's Final Grade Narrative} Does this data provide enough evidence at the 1% significance level to conclude that the final grade and the midterm exam score are positively linearly related?
Correct Answer:

Verified
 vs. Rejection region: t > t 0.01,46 » 2.412 T...
View Answer
Unlock this answer now
Get Access to more Verified Answers free of charge
Correct Answer:
Verified
View Answer
Unlock this answer now
Get Access to more Verified Answers free of charge
Q8: Multiple regression has four requirements for the
Q40: In a multiple regression model, the following
Q99: Real Estate Builder A real estate builder
Q101: Three predictor variables are being considered for
Q102: In testing the validity of a multiple
Q104: In calculating the standard error of the
Q105: Real Estate Builder A real estate builder
Q107: Student's Final Grade A statistics professor investigated
Q108: For the following multiple regression model: <img
Q140: Some of the requirements for the error