Essay
Student's Final Grade A statistics professor investigated some of the factors that affect an individual student's final grade in her course. She proposed the multiple regression model 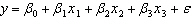 , where y is the final grade (out of 100 points), x 1 is the number of lectures skipped, x 2 is the number of late assignments, and x 3 is the midterm exam score (out of 100). The professor recorded the data for 50 randomly selected students. The computer output is shown below. THE REGRESSION EQUATION IS
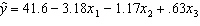
S = 13.74 R - Sq = 30.0%
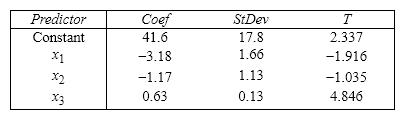
ANALYSIS OF VARIANCE 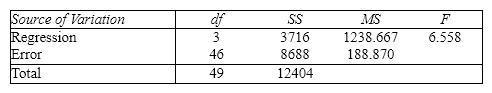 {Student's Final Grade Narrative} Interpret the coefficient b 2.
Correct Answer:

Verified
b 2 = - 1.17. This tells us that for each...View Answer
Unlock this answer now
Get Access to more Verified Answers free of charge
Correct Answer:
Verified
View Answer
Unlock this answer now
Get Access to more Verified Answers free of charge
Q1: Consider the following statistics of a multiple
Q11: Suppose a multiple regression analysis involving 25
Q35: The problem of multicollinearity arises when the:<br>A)dependent
Q36: If a group of independent variables are
Q46: In order to test the significance of
Q70: A multiple regression model involves 40 observations
Q88: When an explanatory variable is dropped from
Q123: In a multiple regression analysis,if the model
Q154: In a multiple regression analysis,there are 20
Q160: In a multiple regression analysis involving 4