Essay
Consider a multinomial experiment involving 100 trials and 3 categories (cells). The observed frequencies resulting from the experiment are shown in the accompanying table.
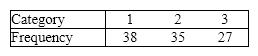 Use the 5% significance level to test the hypotheses H 0: p 1 = 0.45, p 2 = 0.30, p 3 = 0.25 vs. H 1: At least two proportions differ from their specified values.
Correct Answer:

Verified
Rejection region: c 2 > c 20.10,3 = 5.991 Test s...View Answer
Unlock this answer now
Get Access to more Verified Answers free of charge
Correct Answer:
Verified
View Answer
Unlock this answer now
Get Access to more Verified Answers free of charge
Q6: Which of the following conditions is needed
Q23: When comparing two population variances, we use
Q24: A scatter diagram includes the following data
Q29: If we square the t-statistic for two
Q46: A chi-squared test is used to describe
Q79: The test statistic for the chi-squared test
Q94: We use a t-test to determine whether
Q95: In the first-order linear regression model, the
Q147: Which of the following is not an
Q248: Another name for the residual term in