Multiple Choice
Exhibit 1A-9 Multi-curve graph 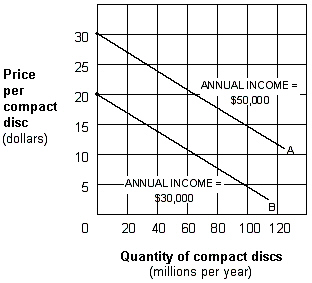 Exhibit 1A-9 represents a three-variable relationship. As the annual income of consumers falls from $50,000 (line A) to $30,000 (line B) , the result is a:
A) rightward movement along each curve.
B) leftward movement along each curve,.
C) leftward shift in curve A to curve B.
D) rightward shift in curve A to curve B.
Correct Answer:

Verified
Correct Answer:
Verified
Q19: Exhibit 1A-3 Straight line <img src="https://d2lvgg3v3hfg70.cloudfront.net/TBX9027/.jpg" alt="Exhibit
Q25: Exhibit 1A-7 Straight line relationship <img src="https://d2lvgg3v3hfg70.cloudfront.net/TBX9027/.jpg"
Q27: Exhibit 1A-6 Straight line <img src="https://d2lvgg3v3hfg70.cloudfront.net/TBX9027/.jpg" alt="Exhibit
Q43: A graph can be used to illustrate
Q47: A graph is one method of expressing
Q66: Direct relationships are illustrated using upward-sloping lines
Q124: An upward-sloping straight line exhibits a direct
Q160: Graphically express a direct and an inverse
Q172: An inverse relationship exists when:<br>A) there is
Q186: The slope of a line parallel to