Multiple Choice
Exhibit 1A-10 Multi-curve graph 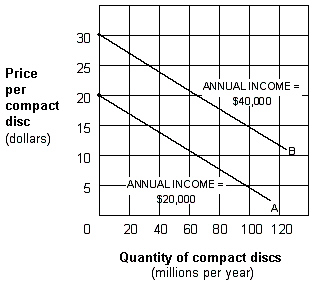 Exhibit 1A-10 represents a three-variable relationship. As the annual income of consumers rises from $20,000 (line A) to $40,000 (line B) , the result is a:
A) rightward movement along each curve.
B) leftward movement along each curve.
C) leftward shift in curve B to curve A.
D) leftward shift in curve A to curve B.
Correct Answer:

Verified
Correct Answer:
Verified
Q25: Distinguish a direct and an inverse or
Q57: Exhibit 1A-7 Straight line relationship <img src="https://d2lvgg3v3hfg70.cloudfront.net/TBX9027/.jpg"
Q58: Exhibit 1A-5 Straight line <img src="https://d2lvgg3v3hfg70.cloudfront.net/TBX9027/.jpg" alt="Exhibit
Q59: Exhibit 1A-2 Straight line <img src="https://d2lvgg3v3hfg70.cloudfront.net/TBX9027/.jpg" alt="Exhibit
Q62: Exhibit 1A-8 Straight line relationship <img src="https://d2lvgg3v3hfg70.cloudfront.net/TBX9027/.jpg"
Q64: Exhibit 1A-4 Straight line <img src="https://d2lvgg3v3hfg70.cloudfront.net/TBX9027/.jpg" alt="Exhibit
Q65: Exhibit 1A-2 Straight line <img src="https://d2lvgg3v3hfg70.cloudfront.net/TBX9027/.jpg" alt="Exhibit
Q66: Exhibit 1A-4 Straight line <img src="https://d2lvgg3v3hfg70.cloudfront.net/TBX9027/.jpg" alt="Exhibit
Q113: A direct relationship is expressed graphically as
Q136: When an inverse relationship is graphed, the