Multiple Choice
Exhibit 10-2 Aggregate supply and demand curves 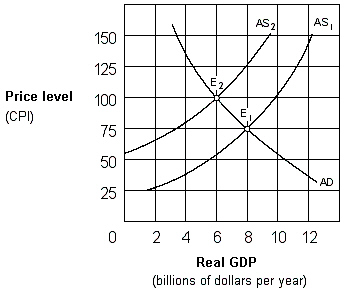 In Exhibit 10-2, the change in equilibrium from E1 to E2 represents:
A) cost-push inflation.
B) demand-pull inflation.
C) price-push inflation.
D) wage-push inflation.
Correct Answer:

Verified
Correct Answer:
Verified
Related Questions
Q18: Which of the following will increase aggregate
Q31: Which one of the following factors will
Q32: Lower taxes on businesses will shift the
Q49: The interest-rate effect is the impact on
Q50: Which of the following events is the
Q55: Discuss the three ranges of the aggregate
Q64: An increase in oil prices will shift
Q121: Which of the following will not shift
Q156: Exhibit 10-1 Aggregate supply curve <img src="https://d2lvgg3v3hfg70.cloudfront.net/TBX9027/.jpg"
Q162: Exhibit 10-7 Aggregate supply and demand curves