menu-iconExamlexExamLexServices

Discover

Ask a Question
  1. All Topics
  2. Topic
    Business
  3. Study Set
    Macroeconomics for Today
  4. Exam
    Exam 10: Aggregate Demand and Supply
  5. Question
    Exhibit 10-3 Aggregate Supply and Demand Curves in Exhibit
Solved

Exhibit 10-3 Aggregate Supply and Demand Curves in Exhibit

Question 114

Question 114

Multiple Choice

Exhibit 10-3 Aggregate supply and demand curves Exhibit 10-3 Aggregate supply and demand curves   In Exhibit 10-3, the change in equilibrium from E<sub>1</sub> to E<sub>2</sub> represents: A) deflation. B) demand-pull inflation. C) price-push inflation. D) cost-push inflation. 
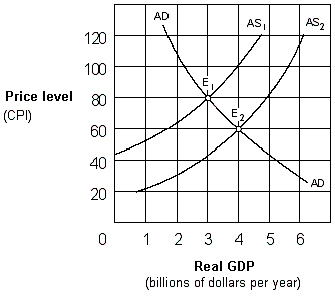
In Exhibit 10-3, the change in equilibrium from E1 to E2 represents:


A) deflation.
B) demand-pull inflation.
C) price-push inflation.
D) cost-push inflation.

Correct Answer:

verifed

Verified

Unlock this answer now
Get Access to more Verified Answers free of charge

Related Questions

Q13: An increase in regulation will shift the

Q27: If aggregate demand increases in the intermediate

Q63: In the intermediate range of the aggregate

Q64: Which of the following is true ,

Q80: When the supply of credit is fixed,

Q89: Given aggregate demand, a decrease in aggregate

Q109: Exhibit 10-6 Aggregate supply curve <img src="https://d2lvgg3v3hfg70.cloudfront.net/TBX9027/.jpg"

Q116: Which of the following is a belief

Q119: Which of the following is not a

Q125: The concurrent problems of inflation and unemployment

Examlex

ExamLex

About UsContact UsPerks CenterHomeschoolingTest Prep

Work With Us

Campus RepresentativeInfluencers

Links

FaqPricingChrome Extension

Download The App

Get App StoreGet Google Play

Policies

Privacy PolicyTerms of ServiceHonor CodeCommunity Guidelines

Scan To Download

qr-code

Copyright © (2025) ExamLex LLC.

Privacy PolicyTerms Of ServiceHonor CodeCommunity Guidelines