Multiple Choice
Exhibit 10-4 Aggregate supply and demand curves 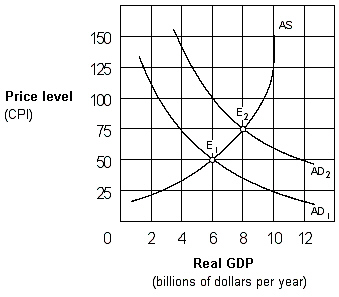 In Exhibit 10-4, point E2 represents:
A) real GDP above full-employment GDP.
B) real GDP that equals full-employment GDP.
C) a depression.
D) real GDP below full-employment GDP.
Correct Answer:

Verified
Correct Answer:
Verified
Q15: The aggregate demand curve is downward sloping.
Q66: Demand-pull inflation is associated with a(n):<br>A) decrease
Q82: The pre-Keynesian or classical economic theory predicted
Q90: _ inflation can be explained by an
Q94: Exhibit 10-8 Aggregate demand and supply <img
Q95: When OPEC caused the price of oil
Q97: Stagflation is a period of time when
Q97: Exhibit 10-8 Aggregate demand and supply <img
Q124: Which of the following helps explain why
Q130: The aggregate demand curve is drawn downward-sloping,because