Multiple Choice
Exhibit 10-7 Aggregate supply and demand curves 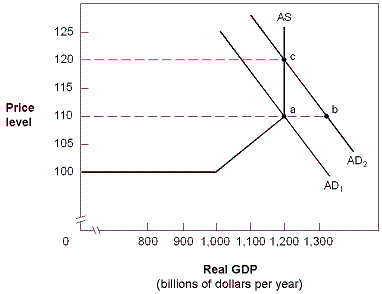 In Exhibit 10-7, the aggregate demand and supply curves reflect an economy in which:
A) full employment is at $1,000 billion GDP.
B) excess aggregate supply is created when there is a shift from AD1 to AD2.
C) excess aggregate demand forces prices up to P = 120.
D) excess aggregate demand causes prices to stabilize at P = 110.
E) a new equilibrium is found at point b.
Correct Answer:

Verified
Correct Answer:
Verified
Q3: Stagflation occurs when the economy experiences:<br>A) low
Q6: The Keynesian range of the aggregate supply
Q15: Exhibit 10-3 Aggregate supply and demand curves
Q30: In the upward-sloping segment of the aggregate
Q48: The effect of an increase in aggregate
Q55: The aggregate supply curve is horizontal in
Q73: The total quantity of goods and services
Q81: The vertical portion of the aggregate supply
Q137: The aggregate supply curve is vertical at
Q145: Cost-push inflation is caused by a leftward