Multiple Choice
Exhibit 17-1 Inflation and unemployment rates 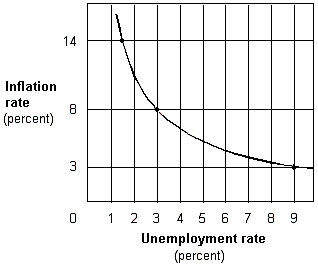 The name of the graph in Exhibit 17-1 is the:
A) Laffer curve.
B) aggregate supply curve.
C) aggregate demand curve.
D) Keynesian curve.
E) Phillips curve.
Correct Answer:

Verified
Correct Answer:
Verified
Q18: Which of the following best describes the
Q41: Under the natural rate hypothesis, expansionary monetary
Q46: "Preannounced, stable policies to achieve a low
Q96: Exhibit 17-3 Aggregate demand and aggregate supply
Q97: Suppose that the economy experiences an increase
Q99: On a Phillips curve diagram, an increase
Q103: Rational expectations theory rejects the concept that
Q104: Movements along the Phillips curve result in
Q105: The Phillips curve:<br>A)is downward sloping.<br>B)is upward sloping.<br>C)shows
Q106: Exhibit 17-4 Short-run and long-run Phillips curves