Multiple Choice
Exhibit 17-1 Inflation and unemployment rates 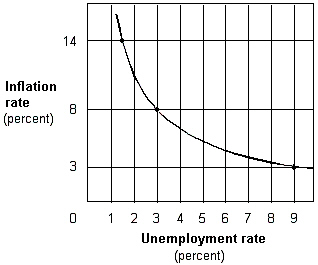 The graph in Exhibit 17-1 indicates a(n) :
A) direct relationship.
B) quadratic relationship.
C) exponential relationship.
D) inverse relationship.
E) hyperbolic relationship.
Correct Answer:

Verified
Correct Answer:
Verified
Q22: The view that decision-maker expectations are based
Q28: The long-run Phillips curve:<br>A) is downward sloping.<br>B)
Q44: The "WIN" button approach to breaking a
Q45: According to rational expectations theory, which of
Q46: The natural rate hypothesis implies that the
Q47: Exhibit 17-2 Aggregate demand and aggregate supply
Q52: If people behave according to rational expectations
Q53: Which of the following groups believes that
Q54: According to rational expectations theory, what information
Q56: Under adaptive expectations theory, a decrease in