Multiple Choice
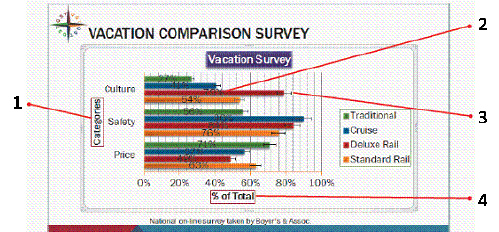 In the figure above, the error bars shown identify potential error amounts relative to each data marker in a(n) ____ series.
A) format
B) data
C) information
D) axis
Correct Answer:

Verified
Correct Answer:
Verified
Related Questions
Q14: _ are small lines of measurement that
Q26: Match each term with its correct description.
Q27: The object you create with a source
Q28: <img src="https://d2lvgg3v3hfg70.cloudfront.net/TBX9090/.jpg" alt=" -In the figure
Q29: To change the space between data series
Q32: _ identify potential error amounts relative to
Q33: You would find a Spanish thesaurus and
Q34: You have _ options for individually animating
Q35: The orientation setting for the slides is
Q36: A PowerPoint presentation is primarily a visual