Multiple Choice
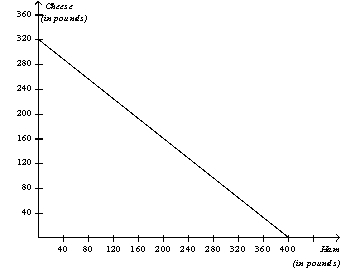
Figure 3-11
The graph below represents the various combinations of ham and cheese (in pounds) that the nation of Bonovia could produce in a given month.

-Refer to Figure 3-11.Whenever Bonovia increases its production of ham by 1 pound per month,then it must decrease its production of cheese by
A) 0.75 pound.
B) 0.80 pound.
C) 1.00 pounds.
D) 1.25 pounds.
Correct Answer:

Verified
Correct Answer:
Verified
Q31: Consider two individuals - Marquis and Serena
Q90: Figure 3-8<br> <img src="https://d2lvgg3v3hfg70.cloudfront.net/TB2185/.jpg" alt="Figure 3-8
Q92: Table 3-18<br>Chris and Tony's Production Opportunities<br> <img
Q93: Table 3-12<br> <img src="https://d2lvgg3v3hfg70.cloudfront.net/TB2185/.jpg" alt="Table 3-12
Q94: Table 3-1<br>Assume that Andia and Zardia can
Q96: Table 3-6<br>Assume that Maya and Miguel can
Q97: Table 3-2<br>Assume that Aruba and Iceland can
Q98: Table 3-12<br> <img src="https://d2lvgg3v3hfg70.cloudfront.net/TB2185/.jpg" alt="Table 3-12
Q99: Table 3-12<br> <img src="https://d2lvgg3v3hfg70.cloudfront.net/TB2185/.jpg" alt="Table 3-12
Q100: Table 3-12<br> <img src="https://d2lvgg3v3hfg70.cloudfront.net/TB2185/.jpg" alt="Table 3-12