Multiple Choice
Figure 4-9
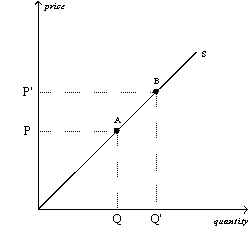
-Refer to Figure 4-9.The movement from point A to point B on the graph represents
A) an increased willingness and ability on the part of suppliers to supply the good at each possible price.
B) an increase in the number of suppliers.
C) a decrease in the price of a relevant input.
D) an increase in the price of the good that is being supplied and the suppliers' responses to that price change.
Correct Answer:

Verified
Correct Answer:
Verified
Q34: If orange juice and apple juice are
Q41: An increase in the price of oranges
Q43: Suppose scientists provide evidence that chocolate pudding
Q69: If sellers expect higher basket prices in
Q73: If car manufacturers begin using new labor-saving
Q92: Currently you purchase ten frozen pizza per
Q113: Suppose the demand for calendars increases in
Q119: New oak tables are normal goods.What would
Q120: Which of the following events would unambiguously
Q222: A newspaper's classified ads are an example