Multiple Choice
Figure 5-13
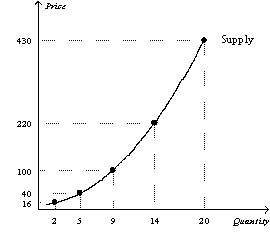
-Refer to Figure 5-13.Over which range is the supply curve in this figure the least elastic?
A) $16 to $40
B) $40 to $100
C) $100 to $220
D) $220 to $430
Correct Answer:

Verified
Correct Answer:
Verified
Related Questions
Q24: Figure 5-13<br> <img src="https://d2lvgg3v3hfg70.cloudfront.net/TB2185/.jpg" alt="Figure 5-13
Q26: Suppose researchers at the University of Wisconsin
Q26: Figure 5-6<br> <img src="https://d2lvgg3v3hfg70.cloudfront.net/TB2185/.jpg" alt="Figure 5-6
Q30: Which of the following expressions is valid
Q35: If a 40% change in price results
Q100: Which of the following is likely to
Q111: If a 6% decrease in price for
Q117: For a good that is a luxury,
Q182: A 10 percent increase in gasoline prices
Q197: Which of the following statements is not