Multiple Choice
Table 7-6

-Refer to Table 7-6.You are selling extra tickets to the Midwest Regional Sweet 16 game in the men's NCAA basketball tournament.The table shows the willingness to pay of the four potential buyers in the market for a ticket to the game.Which of the following graphs represents the market demand curve?
A) 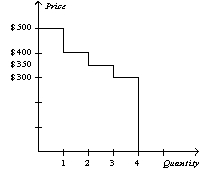
B) 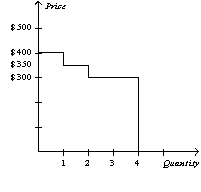
C) 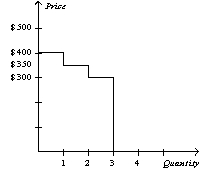
D) 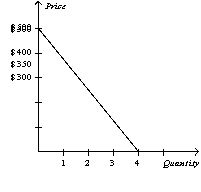
Correct Answer:

Verified
Correct Answer:
Verified
Q1: Consumer surplus is the<br>A)amount of a good
Q17: Table 7-4<br>The numbers in Table 7-1 reveal
Q18: All else equal, an increase in demand
Q29: A drought in California destroys many red
Q40: Efficiency is related to the size of
Q79: Bill created a new software program he
Q205: Producer surplus is the amount a seller
Q356: Figure 7-7<br> <img src="https://d2lvgg3v3hfg70.cloudfront.net/TB2185/.jpg" alt="Figure 7-7
Q361: Figure 7-17<br> <img src="https://d2lvgg3v3hfg70.cloudfront.net/TB2185/.jpg" alt="Figure 7-17
Q362: Figure 7-2<br> <img src="https://d2lvgg3v3hfg70.cloudfront.net/TB2185/.jpg" alt="Figure 7-2