Multiple Choice
Figure 7-2
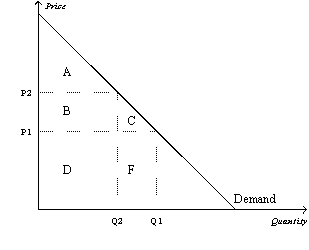
-Refer to Figure 7-2.Area C represents the
A) decrease in consumer surplus that results from a downward-sloping demand curve.
B) consumer surplus to new consumers who enter the market when the price falls from P2 to P1.
C) increase in producer surplus when quantity sold increases from Q2 to Q1.
D) decrease in consumer surplus to each consumer in the market when the price increases from P1 to P2.
Correct Answer:

Verified
Correct Answer:
Verified
Q28: Figure 7-1 <img src="https://d2lvgg3v3hfg70.cloudfront.net/TB2297/.jpg" alt="Figure 7-1
Q65: Table 7-2<br>This table refers to five possible
Q76: Which of the following statements is not
Q79: When there is a technological advance in
Q85: If a consumer places a value of
Q174: If an allocation of resources is efficient,
Q190: Suppose that the equilibrium price in the
Q192: Figure 7-20<br> <img src="https://d2lvgg3v3hfg70.cloudfront.net/TB2185/.jpg" alt="Figure 7-20
Q196: Figure 7-13<br> <img src="https://d2lvgg3v3hfg70.cloudfront.net/TB2185/.jpg" alt="Figure 7-13
Q199: Table 7-10<br> <img src="https://d2lvgg3v3hfg70.cloudfront.net/TB2185/.jpg" alt="Table 7-10