Multiple Choice
Table 7-10

-Refer to Table 7-10.You want to hire a professional photographer to take pictures of your family.The table shows the costs of the four potential sellers in the local photography market.Which of the following graphs represents the market supply curve?
A) 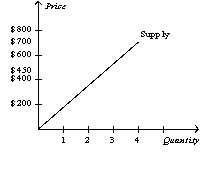
B) 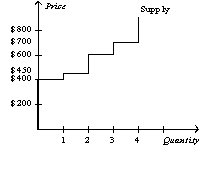
C) 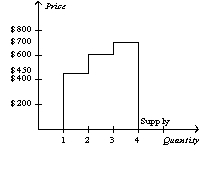
D) 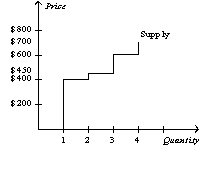
Correct Answer:

Verified
Correct Answer:
Verified
Q18: Table 7-1<br> <img src="https://d2lvgg3v3hfg70.cloudfront.net/TB2185/.jpg" alt="Table 7-1
Q24: Figure 7-22<br> <img src="https://d2lvgg3v3hfg70.cloudfront.net/TB2185/.jpg" alt="Figure 7-22
Q26: Table 7-10<br> <img src="https://d2lvgg3v3hfg70.cloudfront.net/TB2185/.jpg" alt="Table 7-10
Q27: Figure 7-13<br> <img src="https://d2lvgg3v3hfg70.cloudfront.net/TB2185/.jpg" alt="Figure 7-13
Q40: Producer surplus directly measures<br>A)the well-being of sellers.<br>B)production
Q42: Abraham drinks Mountain Dew.He can buy as
Q49: Which of the following events would increase
Q50: Justin builds fences for a living.Justin's out-of-pocket
Q79: Cost is a measure of the<br>A)seller's willingness
Q115: Consumer surplus equals the<br>A)value to buyers minus