Multiple Choice
Figure 7-8
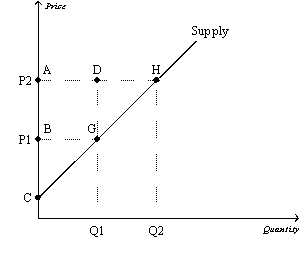
-Refer to Figure 7-8.Which area represents the increase in producer surplus when the price rises from P1 to P2?
A) BCG
B) ACH
C) ABGD
D) AHGB
Correct Answer:

Verified
Correct Answer:
Verified
Q11: Figure 7-10<br> <img src="https://d2lvgg3v3hfg70.cloudfront.net/TB2185/.jpg" alt="Figure 7-10
Q16: Figure 7-11<br> <img src="https://d2lvgg3v3hfg70.cloudfront.net/TB2185/.jpg" alt="Figure 7-11
Q18: Table 7-1<br> <img src="https://d2lvgg3v3hfg70.cloudfront.net/TB2185/.jpg" alt="Table 7-1
Q40: Producer surplus directly measures<br>A)the well-being of sellers.<br>B)production
Q42: Abraham drinks Mountain Dew.He can buy as
Q49: When policymakers are considering a particular action,they
Q50: Justin builds fences for a living.Justin's out-of-pocket
Q59: On a graph,consumer surplus is represented by
Q88: Figure 7-1 <img src="https://d2lvgg3v3hfg70.cloudfront.net/TB2297/.jpg" alt="Figure 7-1
Q200: An example of normative analysis is studying<br>A)how