Multiple Choice
Figure 7-12
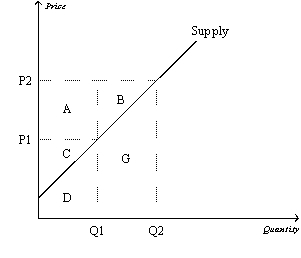
-Refer to Figure 7-12.When the price rises from P1 to P2,which area represents the increase in producer surplus due to new producers entering the market?
A) A
B) B
C) A+B
D) G
Correct Answer:

Verified
Correct Answer:
Verified
Q5: The decisions of buyers and sellers that
Q73: Figure 7-1 <img src="https://d2lvgg3v3hfg70.cloudfront.net/TB2297/.jpg" alt="Figure 7-1
Q96: Suppose Raymond and Victoria attend a charity
Q98: In order to calculate consumer surplus in
Q130: Table 7-5<br>For each of three potential buyers
Q207: Figure 7-18<br> <img src="https://d2lvgg3v3hfg70.cloudfront.net/TB2185/.jpg" alt="Figure 7-18
Q209: Table 7-6<br> <img src="https://d2lvgg3v3hfg70.cloudfront.net/TB2185/.jpg" alt="Table 7-6
Q211: Figure 7-2<br> <img src="https://d2lvgg3v3hfg70.cloudfront.net/TB2185/.jpg" alt="Figure 7-2
Q214: Figure 7-10<br> <img src="https://d2lvgg3v3hfg70.cloudfront.net/TB2185/.jpg" alt="Figure 7-10
Q216: Figure 7-7<br> <img src="https://d2lvgg3v3hfg70.cloudfront.net/TB2185/.jpg" alt="Figure 7-7