Multiple Choice
Figure 7-12
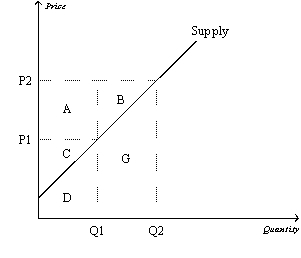
-Refer to Figure 7-12.Area A represents
A) producer surplus to new producers entering the market as the result of an increase in price from P1 to P2.
B) the increase in consumer surplus that results from an upward-sloping supply curve.
C) the increase in total surplus when sellers are willing and able to increase supply from Q1 to Q2.
D) the increase in producer surplus to those producers already in the market when the price increases from P1 to P2.
Correct Answer:

Verified
Correct Answer:
Verified
Q33: Table 7-4<br>The numbers in Table 7-1 reveal
Q57: When a buyer's willingness to pay for
Q68: Inefficiency exists in an economy when a
Q85: Moving production from a high-cost producer to
Q88: Which tools allow economists to determine if
Q99: Total surplus is represented by the area<br>A)under
Q418: Figure 7-18<br> <img src="https://d2lvgg3v3hfg70.cloudfront.net/TB2185/.jpg" alt="Figure 7-18
Q420: Figure 7-3<br> <img src="https://d2lvgg3v3hfg70.cloudfront.net/TB2185/.jpg" alt="Figure 7-3
Q453: Table 7-2<br>This table refers to five possible
Q468: Table 7-3<br>The only four consumers in a