Multiple Choice
Figure 8-9
The vertical distance between points A and C represents a tax in the market. 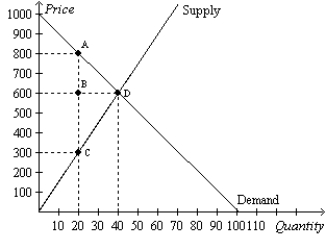
-Refer to Figure 8-9.The equilibrium price and quantity before the imposition of the tax is
A) P=$800 and Q=20.
B) P=$600 and Q=20.
C) P=$300 and Q=20.
D) P=$600 and Q=40.
Correct Answer:

Verified
Correct Answer:
Verified
Q2: Figure 8-5<br>Suppose that the government imposes a
Q3: If a tax shifts the demand curve
Q4: Figure 8-13 <img src="https://d2lvgg3v3hfg70.cloudfront.net/TB2297/.jpg" alt="Figure 8-13
Q5: If T represents the size of the
Q6: When a tax is imposed on the
Q8: Figure 8-9<br>The vertical distance between points A
Q9: Figure 8-5<br>Suppose that the government imposes a
Q10: Figure 8-9<br>The vertical distance between points A
Q11: A deadweight loss is a consequence of
Q12: Figure 8-11 <img src="https://d2lvgg3v3hfg70.cloudfront.net/TB2297/.jpg" alt="Figure 8-11