Multiple Choice
Figure 8-11
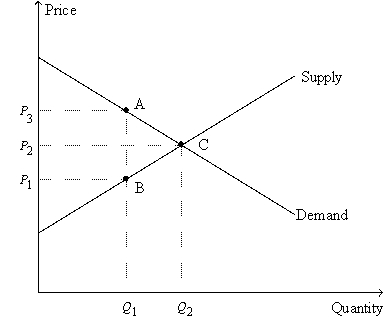
-Refer to Figure 8-11.The price labeled as P₂ on the vertical axis represents the
A) difference between the price paid by buyers after the tax is imposed and the price paid by buyers before the tax is imposed.
B) difference between the price received by sellers before the tax is imposed and the price received by sellers after the tax is imposed.
C) price of the good before the tax is imposed.
D) price of the good after the tax is imposed.
Correct Answer:

Verified
Correct Answer:
Verified
Q4: In the early 1980s,which of the following
Q29: Suppose a tax is imposed on the
Q51: Figure 8-9<br>The vertical distance between points A
Q72: Figure 8-9<br>The vertical distance between points A
Q95: Figure 8-3<br>The vertical distance between points A
Q102: The greater the elasticity of demand, the
Q114: Figure 8-11<br> <img src="https://d2lvgg3v3hfg70.cloudfront.net/TB2185/.jpg" alt="Figure 8-11
Q192: Suppose the tax on liquor is increased
Q196: When the government places a tax on
Q222: A tax<br>A)lowers the price buyers pay and