Multiple Choice
Figure 8-12
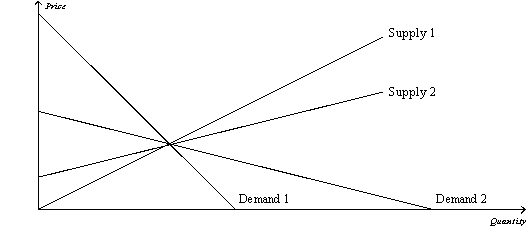
-Refer to Figure 8-12.Which of the following combinations will maximize the deadweight loss from a tax?
A) supply 1 and demand 1
B) supply 2 and demand 2
C) supply 1 and demand 2
D) supply 2 and demand 1
Correct Answer:

Verified
Correct Answer:
Verified
Related Questions
Q11: The Laffer curve illustrates that<br>A)deadweight loss rises
Q12: Assume that for good X the supply
Q34: As the tax on a good increases
Q42: Figure 8-6<br>The vertical distance between points A
Q74: Economists disagree on whether labor taxes have
Q110: If the size of a tax doubles,
Q145: In the market for widgets,the supply curve
Q157: In a recent research paper published by
Q191: Figure 8-2<br>The vertical distance between points A
Q197: Figure 8-6<br>The vertical distance between points A