Multiple Choice
Figure 8-19. The figure represents the relationship between the size of a tax and the tax revenue raised by that tax.
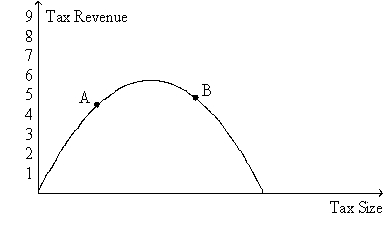
-Refer to Figure 8-19.If the economy is at point A on the curve,then a decrease in the tax rate will
A) increase the deadweight loss of the tax and increase tax revenue.
B) increase the deadweight loss of the tax and decrease tax revenue.
C) decrease the deadweight loss of the tax and increase tax revenue.
D) decrease the deadweight loss of the tax and decrease tax revenue.
Correct Answer:

Verified
Correct Answer:
Verified
Q2: Taxes are of interest to<br>A)microeconomists because they
Q4: Who once said that taxes are the
Q19: Which of the following events always would
Q48: Figure 8-10 <img src="https://d2lvgg3v3hfg70.cloudfront.net/TB2297/.jpg" alt="Figure 8-10
Q63: Figure 8-9<br>The vertical distance between points A
Q69: When demand is relatively elastic, the deadweight
Q82: Figure 8-6<br>The vertical distance between points A
Q96: Which of the following quantities decrease in
Q215: When a tax is levied on the
Q406: Figure 8-7<br>The vertical distance between points A