Multiple Choice
Figure 20-2
Number of Poor
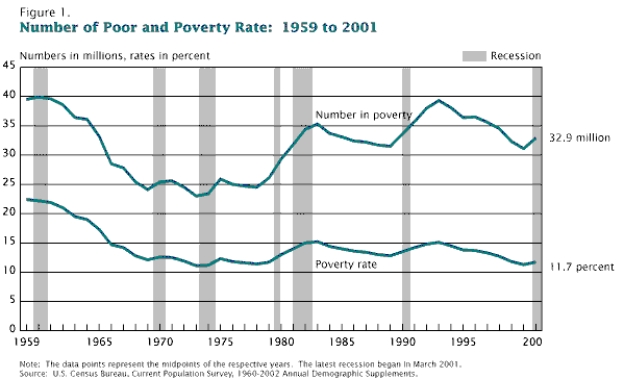
-Refer to Figure 20-2.Between 1959 and 2001 the poverty rate has
A) increased overall.
B) decreased overall.
C) stayed the same overall.
D) moved in the opposite direction of the number of people in poverty.
Correct Answer:

Verified
Correct Answer:
Verified
Q19: Comparing the United States household income distribution
Q182: Anti-poverty programs<br>A)encourage saving among recipient groups.<br>B)impose a
Q189: A common criticism of government programs that
Q315: Which of the following is not correct?<br>A)Many
Q323: Table 20-3<br>The Distribution of Income in Hapland<br>
Q331: Table 20-1<br>The following table shows the distribution
Q445: In the United States, long-term poverty affects<br>A)more
Q468: The Smith family owns an apple orchard
Q471: Which of the following programs would be
Q478: Which of the following statements is not