Multiple Choice
The following diagram shows two budget lines: A and B. 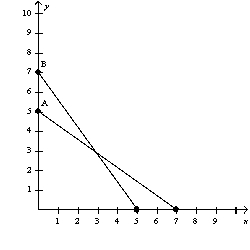
Which of the following could explain the change in the budget line from A to B?
A) a decrease in income and a decrease in the price of X
B) a decrease in income and an increase in the price of X
C) an increase in income and a decrease in the price of X
D) an increase in income and an increase in the price of X
Correct Answer:

Verified
Correct Answer:
Verified
Q188: Figure 21-1<br> <img src="https://d2lvgg3v3hfg70.cloudfront.net/TB2185/.jpg" alt="Figure 21-1
Q190: A consumer's preferences for $1 bills and
Q195: Figure 21-20<br> <img src="https://d2lvgg3v3hfg70.cloudfront.net/TB2185/.jpg" alt="Figure 21-20
Q322: Figure 21-8 <img src="https://d2lvgg3v3hfg70.cloudfront.net/TB1273/.jpg" alt="Figure 21-8
Q328: A consumer consumes two normal goods, coffee
Q459: Consider the budget constraint between "spending today"
Q471: If Walter has one hour of leisure
Q481: Suppose the price of good X falls.
Q487: A consumer chooses an optimal consumption point
Q552: The slope of the budget constraint is