Figure 21-19 The Following Graph Illustrates a Representative Consumer's Preferences for Marshmallows
Multiple Choice
Figure 21-19
The following graph illustrates a representative consumer's preferences for marshmallows and chocolate chip cookies:
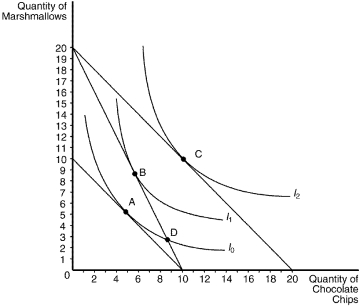
-Refer to Figure 21-19.Assume that the consumer has an income of $100 and currently optimizes at bundle A.When the price of marshmallows decreases to $5,which bundle will the optimizing consumer choose?
A) A
B) B
C) C
D) D
Correct Answer:

Verified
Correct Answer:
Verified
Q84: A typical indifference curve is upward sloping.
Q96: The indifference curves for perfect substitutes are
Q97: Suppose at the consumer's current consumption bundle
Q171: When Phil's income increases,he purchases fewer spaghetti
Q207: The substitution effect from an increase in
Q325: When the price of a good increases,
Q379: If the interest rate rises, an individual
Q404: Bundle L contains 10 units of good
Q435: Figure 21-8 <img src="https://d2lvgg3v3hfg70.cloudfront.net/TB1273/.jpg" alt="Figure 21-8
Q482: Two economists found empirical evidence that when