Multiple Choice
Exhibit 19-1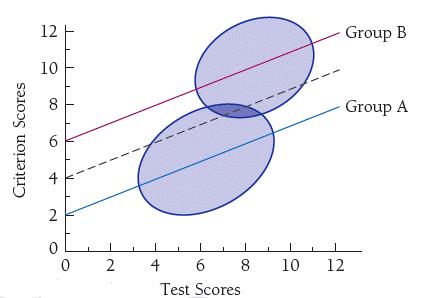
Refer to Exhibit 19-1. The regression line for the combination of groups A and B in the above figure yields a predicted score of approximately ____ for a test score of 6.
A) 4.0
B) 5.5
C) 7.0
D) 8.5
Correct Answer:

Verified
Correct Answer:
Verified
Related Questions
Q1: Studies that have examined the correlation between
Q3: Should standardized testing be reduced in schools?
Q4: The textbook takes the position that observed
Q5: What are the underlying assumptions of the
Q6: Which of the following is true of
Q7: According to _, selection procedures are biased
Q8: Which model of test fairness selects more
Q9: Some people might advocate that separate regression
Q10: Meagan grew up in a small rural
Q11: An estimated learning potential is<br>A)a score on