Multiple Choice
Exhibit 19-1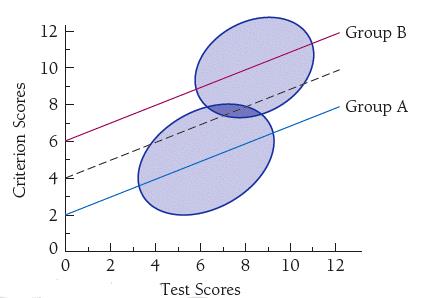
Refer to Exhibit 19-1. The combined regression line in the figure ____ predicts Group A and ____ predicts Group B.
A) accurately; accurately
B) accurately; under
C) under; over
D) over; under
Correct Answer:

Verified
Correct Answer:
Verified
Related Questions
Q14: Design an intervention to increase growth mindsets
Q15: Flaugher (1978)contends that arguments about test bias
Q16: The phrase "everyone can succeed if they
Q17: Which of the following is true of
Q18: A way in which the differences between
Q20: The real dispute about racial differences in
Q21: The SOMPA system uses portions of the<br>A)BITCH.<br>B)Chitling
Q22: The BITCH may help to assess<br>A)the extent
Q23: Which of the following is defined by
Q24: Which SOMPA component uses the norms within