Multiple Choice
Exhibit 6A This is a reaction going on in your muscle cells right this very minute:  The enzyme triose phosphate isomerase catalyzes this reaction in the forward direction as part of the glycolytic pathway. It follows simple Michaelis-Menten kinetics:
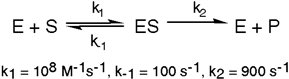
Typical cellular concentrations: triose phosphate isomerase = 0.1 nM
Dihydroxyacetone phosphate = 5 µM glyceraldehyde-3-phosphate = 2 µM
Refer to Exhibit 6A. "Restrainin" is an inhibitor of triose phosphate isomerase. When it is added to cells at a concentration of 0.4 nM, the enzyme's apparent KM for the substrate is altered to 100 µM, but the Vmax is unchanged.
In the following graph, which line best represents the Lineweaver-Burk plot obtained in the presence of restrainin? 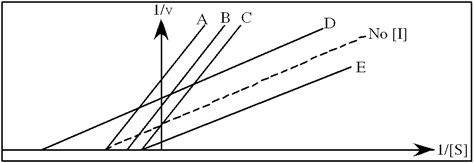
A) A
B) B
C) C
D) D
E) E
Correct Answer:

Verified
Correct Answer:
Verified
Q21: Irreversible inhibitors of enzymatic reactions<br>A) bind to
Q22: The Michaelis-Menten approach to describing the kinetics
Q23: Inhibitors can have the following effects on
Q24: Exhibit 6A This is a reaction going
Q25: Which of the following inhibitors binds to
Q27: In the reaction catalyzed by chymotrypsin, a
Q28: Explain the mechanism of the lock-and-key
Q29: The value of V<sub>max</sub> changes in<br>A) competitive
Q30: The rate of the reaction of glycogen
Q31: Which of the following statements regarding the