Multiple Choice
Figure 53-1 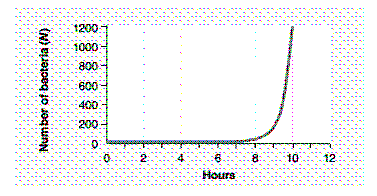
The graph in the accompanying figure would best be described as:
A) being characteristic of exponential growth.
B) being characteristic of arithmetic growth.
C) an S-shaped curve.
D) a J-shaped curve.
E) being a J-shaped curve characteristic of exponential growth.
Correct Answer:

Verified
Correct Answer:
Verified
Q38: Clumped dispersion is often influenced by:<br>A) the
Q39: Figure 53-5 <br><img src="https://d2lvgg3v3hfg70.cloudfront.net/TBX8678/.jpg" alt="Figure 53-5
Q40: When the size of a population begins
Q41: A group of cacti on a sun-exposed
Q42: Match the population-influencing factor or definition with
Q44: Interference competition is also called contest competition.
Q45: An exponential growth curve has a J
Q46: Figure 53-4 <br><img src="https://d2lvgg3v3hfg70.cloudfront.net/TBX8678/.jpg" alt="Figure 53-4
Q47: Organisms such as oysters or fish that
Q48: A killing frost is an example of