Multiple Choice
Figure 53-3 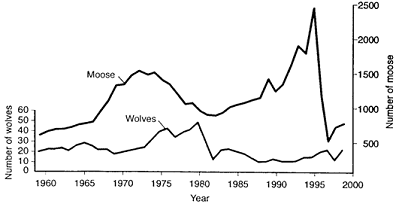
Based on the accompanying figure, the decline in the moose population in 1996 was most likely due to a(n) :
A) predictable increase in the wolf population.
B) unpredictable increase in the wolf population.
C) decrease in the intrinsic rate of increase for the moose population.
D) decline in the food supply.
E) unknown disease organism.
Correct Answer:

Verified
Correct Answer:
Verified
Q8: Which of the following organisms would have
Q9: When r = −0.00057, the population size:<br>A)
Q10: The average number of children born to
Q11: Figure 53-4 <br><img src="https://d2lvgg3v3hfg70.cloudfront.net/TBX8678/.jpg" alt="Figure 53-4
Q12: A human population that is shrinking would
Q14: Scramble competition results when all individuals in
Q15: Match the competition type with its description.
Q16: Which of the following is a correct
Q17: In a human population with a high
Q18: Which of the following relationships is incorrectly