Multiple Choice
Figure 53-5 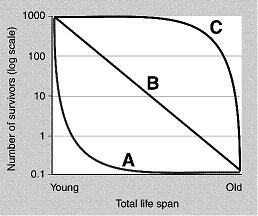
Refer to the accompanying figure. How would the survivorship curve for elephants be represented?
A) The curve A
B) The curve B
C) The curve C
D) Either A or C, depending on the species
E) Elephant populations would be better represented by a curve falling between A and B.
Correct Answer:

Verified
Correct Answer:
Verified
Q76: Which of the following pairs is incorrectly
Q77: Explain how environmental degradation is related to
Q78: Iteroparity is common in which of the
Q79: Which of the following have local reproductive
Q80: Match the competition type with its description.
Q82: The largest population that can be maintained
Q83: Generally, r -selected organisms exhibit:<br>A) short life
Q84: An example of a density-dependent factor that
Q85: The Earth's carrying capacity is:<br>A) 1 billion.<br>B)
Q86: The logistic equation:<br>A) models a J-shaped growth