Multiple Choice
Figure 53-1 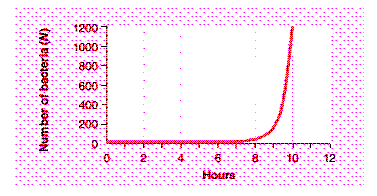 The graph in the accompanying figure would best be described as:
A) being characteristic of exponential growth.
B) being characteristic of arithmetic growth.
C) an S-shaped curve.
D) a J-shaped curve.
E) being a J-shaped curve characteristic of exponential growth.
Correct Answer:

Verified
Correct Answer:
Verified
Q4: Density-independent factors:<br>A) influence population size and are
Q9: When r = −0.00057, the population size:<br>A)
Q12: A human population that is shrinking would
Q48: A killing frost is an example of
Q58: Which set of values would result in
Q58: Using the demographic terms presented in this
Q59: Biologists in which of the following applied
Q62: Which of the following organisms would have
Q65: K strategists typically produce large numbers of
Q87: In Type-I survivorship, the young have a