Multiple Choice
Figure 53-1 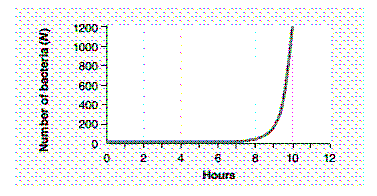 The equation that would best describe the curve in the accompanying figure is:
A) dN / dt = r .
B) dN / dt = N .
C) dN / dt = rN .
D) dN / dt = rN + I − e .
E) dN / dt = rN ( K − N ) .
Correct Answer:

Verified
Correct Answer:
Verified
Q3: The world human population has increased dramatically
Q20: Figure 53-5 <img src="https://d2lvgg3v3hfg70.cloudfront.net/TBX8677/.jpg" alt="Figure 53-5
Q21: The organisms associated with patches of floating
Q22: Less-developed countries are most likely to be
Q23: Match the population-influencing factor or definition with
Q27: Which of the following consists of organisms,
Q28: Surplus individuals in the _ disperse and
Q85: The Earth's carrying capacity is:<br>A) 1 billion.<br>B)
Q89: Consumption overpopulation is a problem in developing
Q95: Most insects and invertebrates are said to