Multiple Choice
Figure 53-2 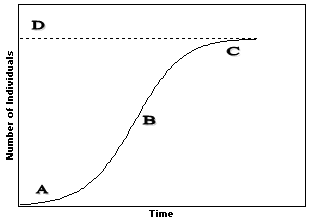 Refer to the accompanying figure. At which point on the graph is the population increasing exponentially?
A) A
B) B
C) C
D) D
E) There is no exponential increase on this graph.
Correct Answer:

Verified
Correct Answer:
Verified
Q10: Which of the following series correctly represents
Q11: What British clergyman and economist was one
Q14: Figure 53-2 <img src="https://d2lvgg3v3hfg70.cloudfront.net/TBX8677/.jpg" alt="Figure 53-2
Q17: In a human population with a high
Q18: Figure 53-2 <img src="https://d2lvgg3v3hfg70.cloudfront.net/TBX8677/.jpg" alt="Figure 53-2
Q20: Figure 53-5 <img src="https://d2lvgg3v3hfg70.cloudfront.net/TBX8677/.jpg" alt="Figure 53-5
Q47: Organisms such as oysters or fish that
Q83: Generally, r -selected organisms exhibit:<br>A) short life
Q86: The logistic equation:<br>A) models a J-shaped growth
Q92: Source habitats are areas where reproductive success