Multiple Choice
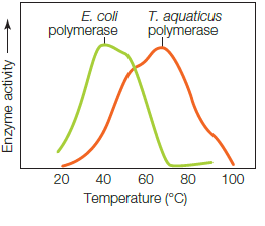 The graph shows the temperature profile for T. aquaticus polymerase, an enzyme used by a species of bacteria that lives in hot springs. What does the boxed region indicate?
A) The enzyme activity increases as substrates increase their kinetic energy.
B) The enzyme activity decreases as substrates increase their kinetic energy.
C) The enzyme activity increases as the enzyme denatures.
D) The enzyme activity decreases as the enzyme denatures.
E) The enzyme activity decreases as the enzyme refolds.
Correct Answer:

Verified
Correct Answer:
Verified
Q18: Unlike plants, fungi, and bacteria, animal cells
Q26: The amount of turgor that is enough
Q39: If the activation energy for a chemical
Q41: A metabolic reaction will most likely reverse
Q52: What reaction does the enzyme alcohol dehydrogenase
Q55: The fact that the earth does not
Q64: Diffusion of water from a hypertonic solution
Q71: Movement of substances that requires the expenditure
Q76: An enzyme's specificity is based on _.<br>A)
Q91: The minimum amount of energy needed to