Multiple Choice
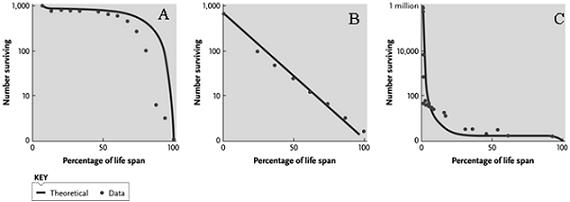
-Answer the question using the accompanying figure. A species with a relatively constant rate of mortality in all age classes would most likely exhibit which survivorship curve?
A) Type I, which is graph A
B) Type II, which is graph B
C) Type I, which is graph C
D) Type III, which is graph C
E) Type III, which is graph A
Correct Answer:

Verified
Correct Answer:
Verified
Q79: Which of these species' population growth rate
Q80: Which phenotypic effects does crowding have on
Q81: A population of mostly _ individuals with
Q82: How are an organism's lifetime energy use
Q83: Which statement describes the general relationship between
Q85: <img src="https://d2lvgg3v3hfg70.cloudfront.net/TBX8681/.jpg" alt=" -Answer the
Q86: Population dispersion is the _.<br>A) statistical description
Q87: Research has shown that commercial fisheries place
Q88: A(n) _ is a group of neighboring
Q89: Match each of the following terms with