Multiple Choice
Figure 2-1 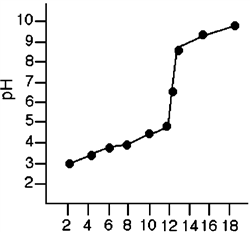
Refer to Figure 2-1. Which of these statements is true based on the data provided by the graph?
A) The pH of the solution must be determined algebraically.
B) The pH of the solution is relatively unaffected by the addition of base.
C) The pH of the solution is 7 when approximately 12 mL of base have been added.
D) The pH of the solution is relatively constant with addition of the first 14 mL of base.
E) The pH of the solution rises significantly when the volume is increased from 14 mL to 18 mL.
Correct Answer:

Verified
Correct Answer:
Verified
Q2: Which of these numbers has the most
Q3: Which is the standard SI unit for
Q4: When multiplying and dividing, the number of
Q5: How many significant figures are there in
Q6: An irregular shaped piece of metal with
Q8: Which is the correct SI unit for
Q9: How many significant figures are there in
Q10: An international group of zookeepers with successful
Q11: Because of the high heat and humidity
Q52: Solve the following equation for x: 13x