Multiple Choice
Figure 1-1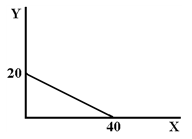
The slope of the line in Figure 1-1 is
A) 0.5.
B) 2.0.
C) −0.5.
D) −2.0.
Correct Answer:

Verified
Correct Answer:
Verified
Related Questions
Q19: Slope is measured as run/rise.
Q56: The law of comparative advantages explains why<br>A)advanced
Q80: An economic model is a realistic depiction
Q106: When residents surrounding an airport complain about
Q133: A graph conveys information about a cause-and-effect
Q167: Opportunity cost is the highest possible price
Q179: A theory is a deliberate simplification or
Q185: Abstraction ignores many details in order to
Q206: If you leave your money in the
Q213: When voluntary trade takes place,<br>A)both parties can