Multiple Choice
Table 3-2 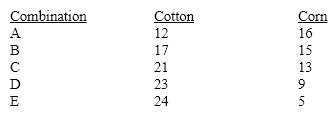 The concept of opportunity cost can be represented graphically by the
A) area inside the production possibilities frontier.
B) slope of the production possibilities frontier.
C) vertical distance from the horizontal axis to the production possibilities frontier.
D) horizontal distance from the vertical axis to the production possibilities frontier.
E) sum of the horizontal and vertical distances to the production possibilities frontier.
Correct Answer:

Verified
Correct Answer:
Verified
Q36: Increasing opportunity cost tends to occur if<br>A)management
Q51: The division of labor generally refers to
Q55: Which of the following is a listing
Q90: How do economists define efficiency? Elaborate.
Q119: Optimal decisions are made based upon the
Q124: Scarcity can be measured only through the
Q131: Although all points on the production possibilities
Q141: All of the points inside a production
Q157: Table 3-2 <img src="https://d2lvgg3v3hfg70.cloudfront.net/TB8592/.jpg" alt="Table 3-2
Q260: Figure 3-3<br><img src="https://d2lvgg3v3hfg70.cloudfront.net/TBX9029/.jpg" alt="Figure 3-3