Multiple Choice
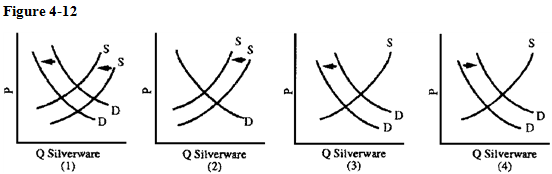
The silverware industry has been in serious decline since the 1980s. Family dining habits are less formal so people purchase less silverware. More recently, the price of silver jumped from $5 to $20 per ounce. Which graph in Figure 4-12 best illustrates these developments?
A) 1
B) 2
C) 3
D) 4
Correct Answer:

Verified
Correct Answer:
Verified
Q51: The major drawback of a price ceiling
Q58: <img src="https://d2lvgg3v3hfg70.cloudfront.net/TBX9029/.jpg" alt=" Show graphically
Q99: <img src="https://d2lvgg3v3hfg70.cloudfront.net/TB8592/.jpg" alt=" -As the general
Q119: If orange juice prices fall by 25
Q123: If the price of coal, a close
Q218: An increase in the price of poultry
Q259: The wage rate is the price of
Q272: At an equilibrium price, quantity demanded<br>A)exceeds quantity
Q285: Price floors set a legal minimum price
Q297: Black-market prices are below equilibrium prices because