Multiple Choice
Figure 5-1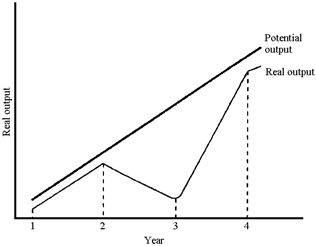
Figure 5-1 plots potential and real output for a hypothetical economy. Based on this graph, the recession occurred
A) between years 1 and 2.
B) between years 2 and 3.
C) between years 3 and 4.
D) after year 4.
Correct Answer:

Verified
Correct Answer:
Verified
Q3: Aneta has owned an Italian sports car
Q7: To fight recession, the government may<br>A)decrease aggregate
Q12: Real GDP is another term for<br>A)current dollar
Q36: Recessions<br>A)almost never occur in the American economy.<br>B)follow
Q38: Keynes' great book offered the promise of
Q49: Which of the following would be measured
Q91: John Maynard Keynes wrote The General Theory
Q159: Gross domestic product is the<br>A)most comprehensive measure
Q172: The movements of real GDP and inflation
Q175: The Great Recession is remembered by most