Multiple Choice
Aggregate demand and supply curves have been widely used to analyze the performance of the macroeconomy. Figure 5-3 shows four diagrams that represent different changes in the macroeconomy. Choose the diagram that best represents the situations described in the following questions. Figure 5-3 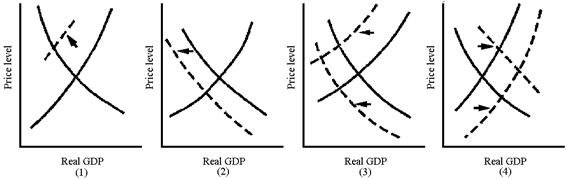
Which graph in Figure 5-3 best represents the aggregate demand-induced Great Depression of the 1930s?
A) 1
B) 2
C) 3
D) 4
Correct Answer:

Verified
Correct Answer:
Verified
Q5: Dissatisfaction with public school education has led
Q35: The Iranian Revolution in 1979 led to
Q37: Gross domestic product includes<br>A)your purchase of 100
Q45: Define and distinguish between real and nominal
Q46: What was suggested by Keynes to move
Q82: According to the text, the government can
Q84: An economist who studies the sales and
Q111: The price controls on consumer goods during
Q158: An increase in aggregate demand will result
Q179: If the prices of all goods and