Multiple Choice
Aggregate demand and supply curves have been widely used to analyze the performance of the macroeconomy. Figure 5-3 shows four diagrams that represent different changes in the macroeconomy. Choose the diagram that best represents the situations described in the following questions. Figure 5-3 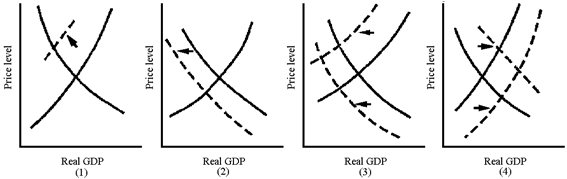
Which graph in Figure 5-3 best represents the economic conditions of the American economy in 2001?
A) 1
B) 2
C) 3
D) 4
Correct Answer:

Verified
Correct Answer:
Verified
Q40: The first year of the Bush administration
Q61: During the first year of the Obama
Q62: Nominal GDP is calculated by using<br>A)prices set
Q70: The clearest sign of inflation would be
Q78: John Maynard Keynes wrote that economies can
Q81: Since countries differ in the amount of
Q107: Gross domestic product accurately measures the environmental
Q181: Intermediate goods, like milk sold by a
Q211: If aggregate demand shifts outward over a
Q212: International per capita GDP comparisons are misleading