Multiple Choice
Figure 8-1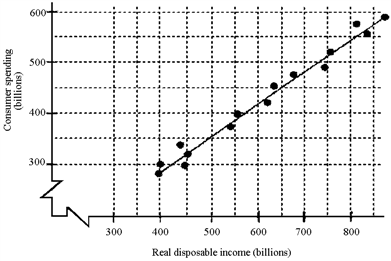
Based on the scatter diagram in Figure 8-1, approximately how much will consumption increase after a permanent tax cut of $400 billion?
A) $100 billion
B) $150 billion
C) $250 billion
D) $350 billion
Correct Answer:

Verified
Correct Answer:
Verified
Q8: Imports are a leakage in the sense
Q26: If Kobe, an NBA star athlete, earns
Q29: The federal government's principal tool in altering
Q30: Changes to the price level affect consumers'
Q64: Figure 8-1<br> <img src="https://d2lvgg3v3hfg70.cloudfront.net/TB8592/.jpg" alt="Figure 8-1
Q79: Plant, equipment, software, new housing, and inventories
Q145: If households decrease the amount of bank
Q146: U.S.imports rise when income in the United
Q154: The value of intermediate goods is not
Q184: In the circular flow model, which of