Multiple Choice
Figure 8-1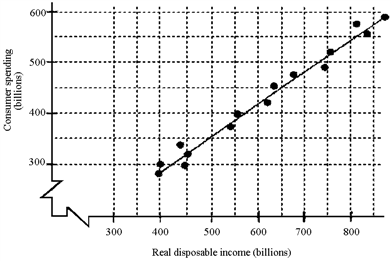
Given the scatter diagram in Figure 8-1, if real disposable income is $600 billion and asset wealth increases by $100 billion, how much will consumers spend?
A) $550 billion
B) $450 billion
C) $600 billion
D) Cannot be determined
Correct Answer:

Verified
Correct Answer:
Verified
Q24: A scatter diagram could help a policy
Q63: When GDP is calculated as the final
Q98: If the price level increases, we would
Q102: When aggregate demand decreases rapidly, the economy
Q128: Which of the following is not part
Q130: Aggregate demand is the total demand for<br>A)all
Q143: Employee compensation accounts for about what percentage
Q148: The net exports adjustments in aggregate demand
Q156: When computing gross domestic product, government services
Q160: If U.S.consumers become more optimistic about their